Evolution of Food Prices - Power BI report
The data for this report is from FAOSTAT - Foond and Agriculture Organization of the United Nations and it is available here.
The dataset contains data on Agriculture Producer Prices and Producer Price Index. Agriculture Producer Prices are prices received by farmers for primary crops, live animals and livestock primary products as collected at the point of initial sale (prices paid at the farm-gate). Annual data are provided from 1991, while monthly data from January 2010 for 180 countries and 212 products.
The report is interactive, so the user can explore insights by country, by item, and also browse through the items with the highest price increase (by time interval and country).
Below are a few screenshots with insights from the report
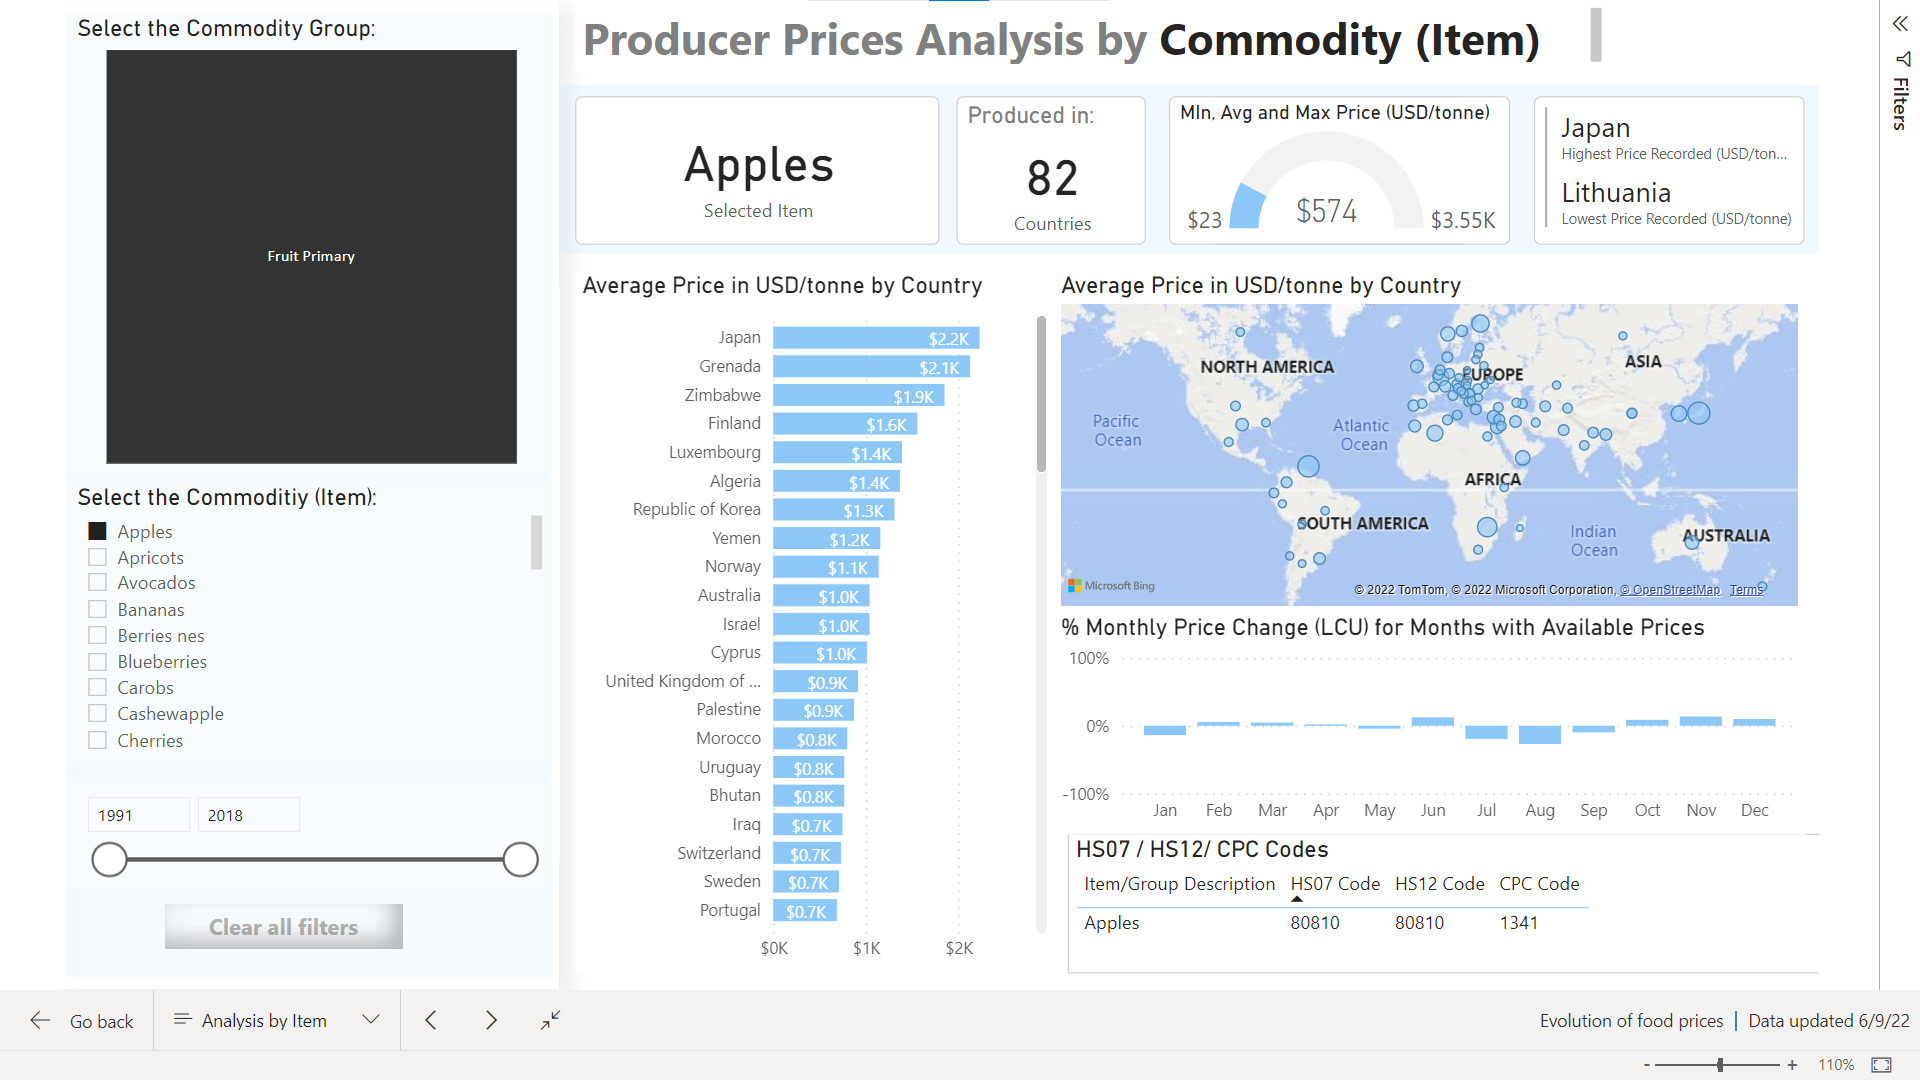
1. The analysis by country allows the user to explore food prices evolution by country, time interval and commodity group. In the screenshot below we can see the information for Canada, between 2003 and 2018, for all food categories: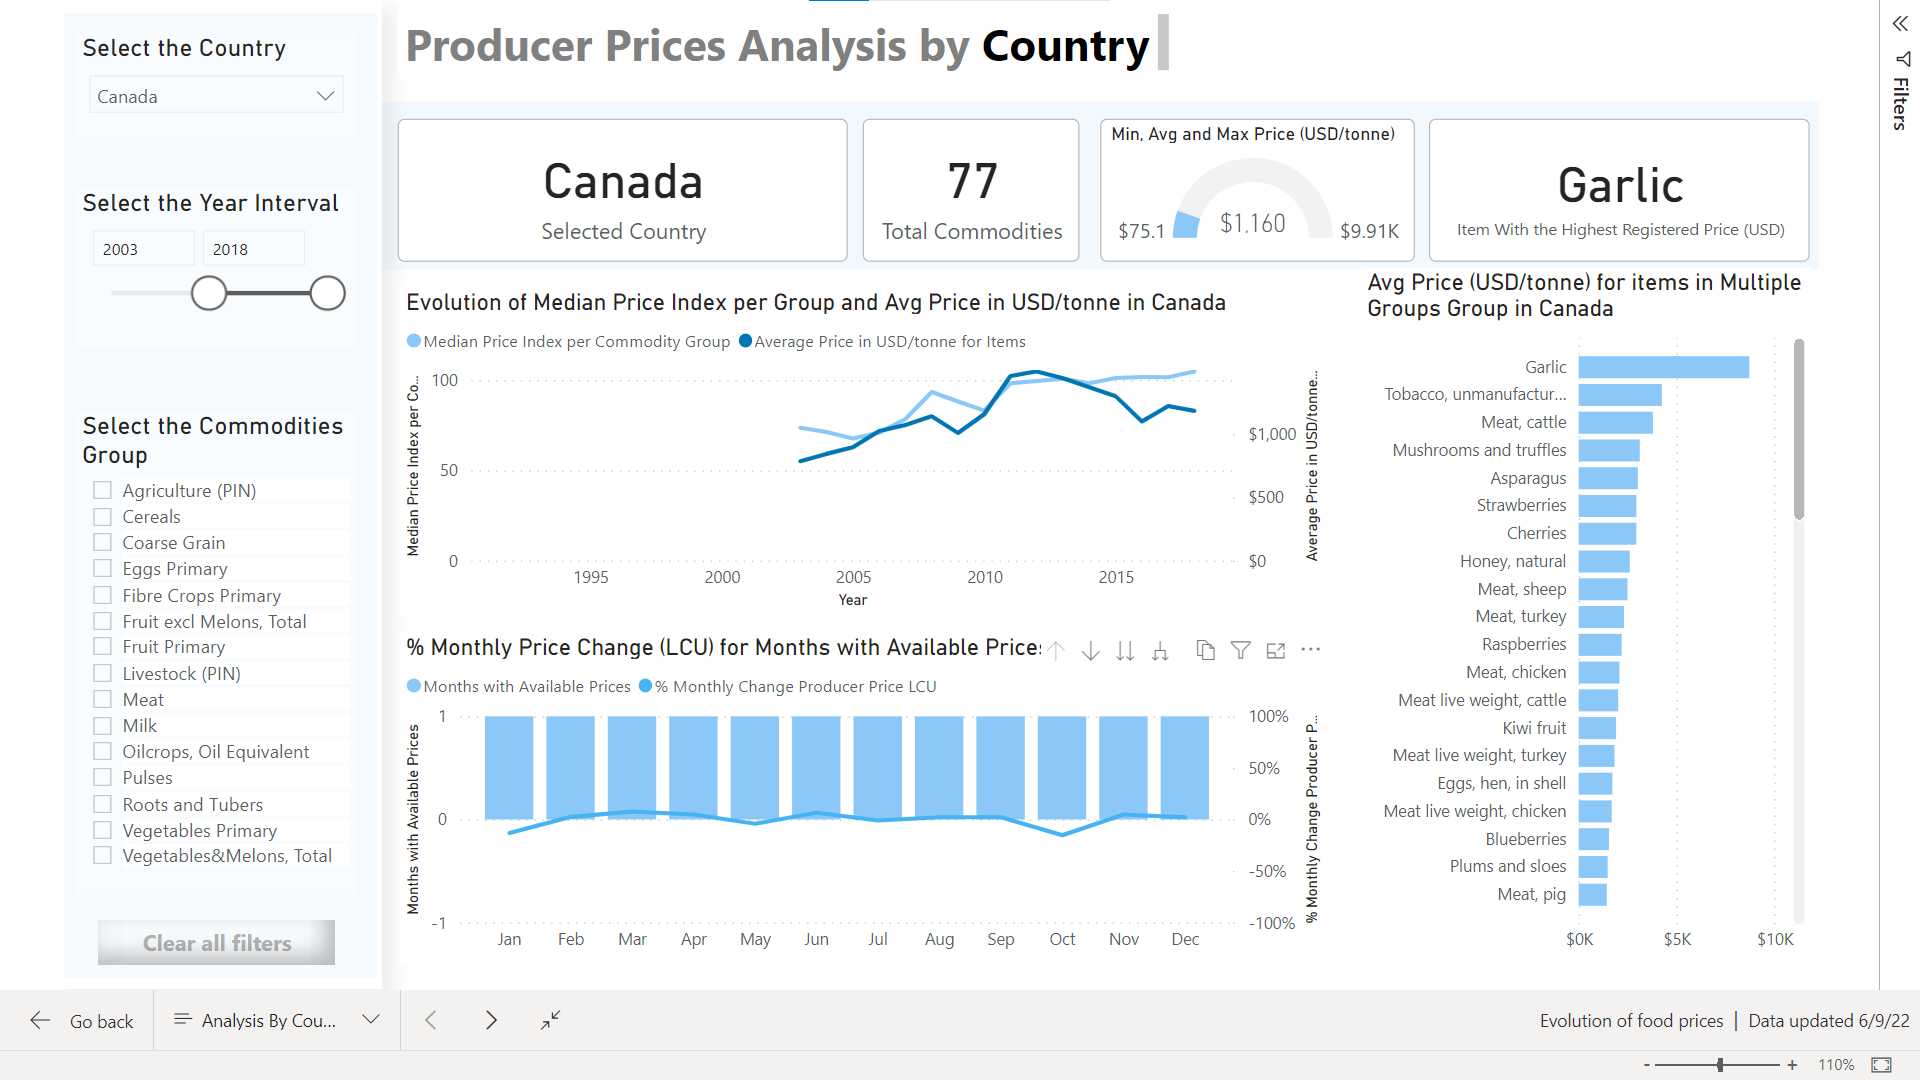 2. Below we can see the analysis by item (we can select the item and time interval). We're looking at apples - most expensive in Japan, most popular and affordable in Europe. The price per tonne can range drastically from $23 USD to $3,550 USD, depending on the country that's producing them:
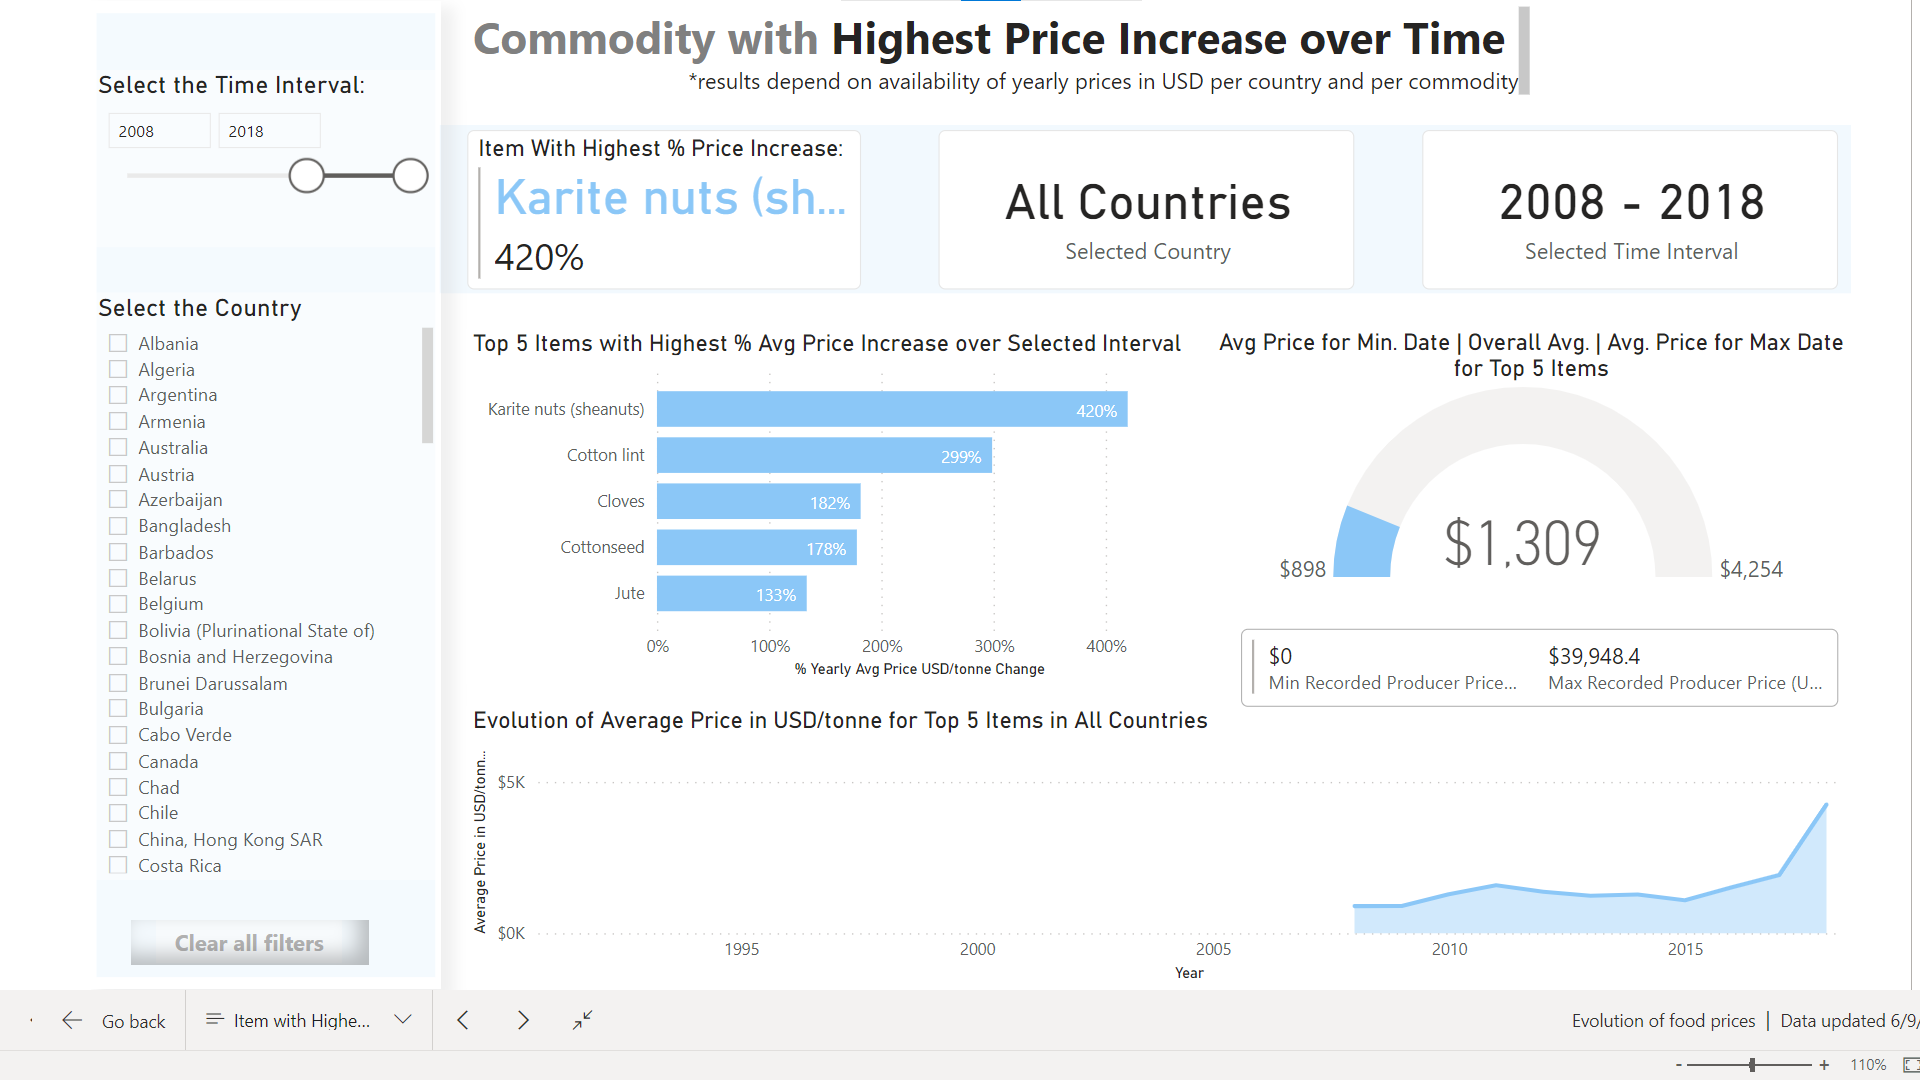
 3. Prices change and sometimes at impressive rates. Here's a look at the items with the most impressive price increases over time (for all countries, between 2008 - 2018). The data can be also explored by other time intervals and filtered by country:
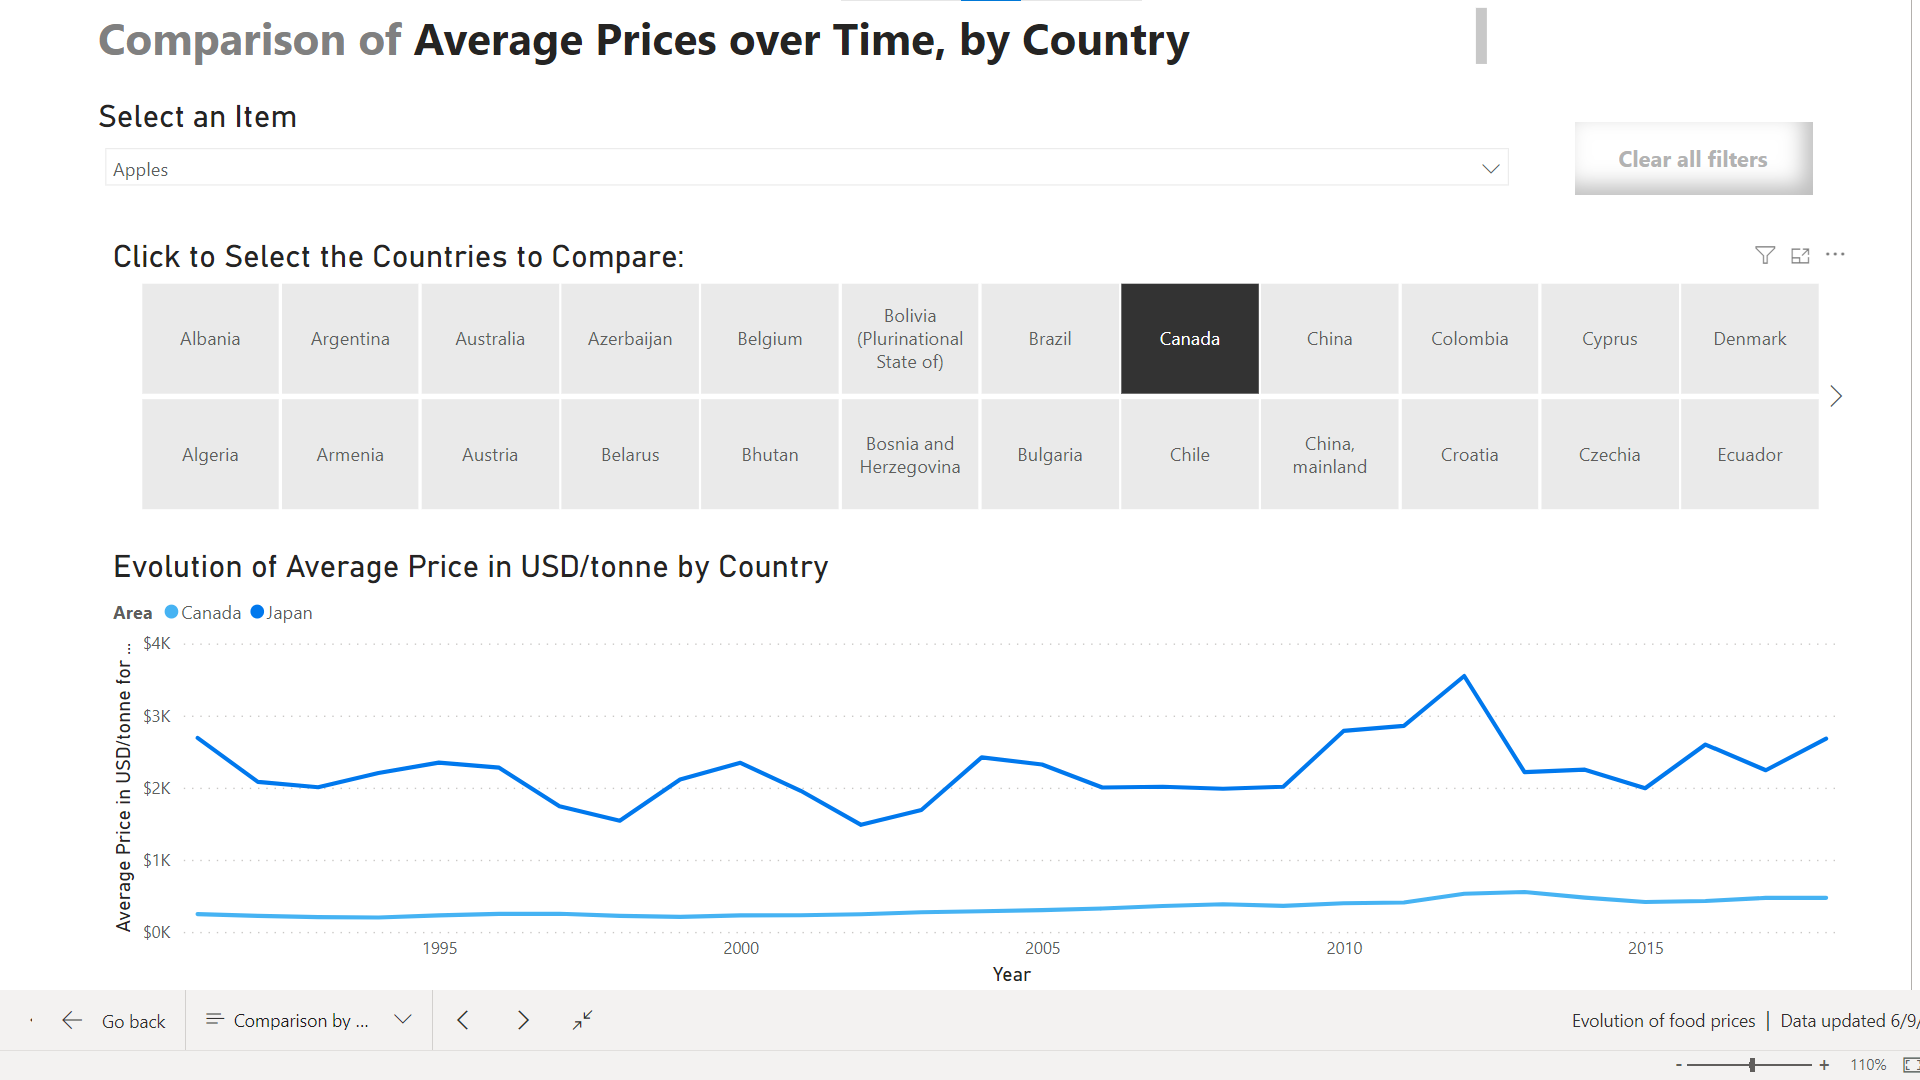
 4. We can also compare the price of an item by the country that produces it. Here's an example of the evolution of apple prices, when we compare the prices in Canada vs Japan. The user can select any item and any number of countries to compare: